Today in class we focused on population pyramids. We talked about the three different shapes most pyramids possess. The three types are
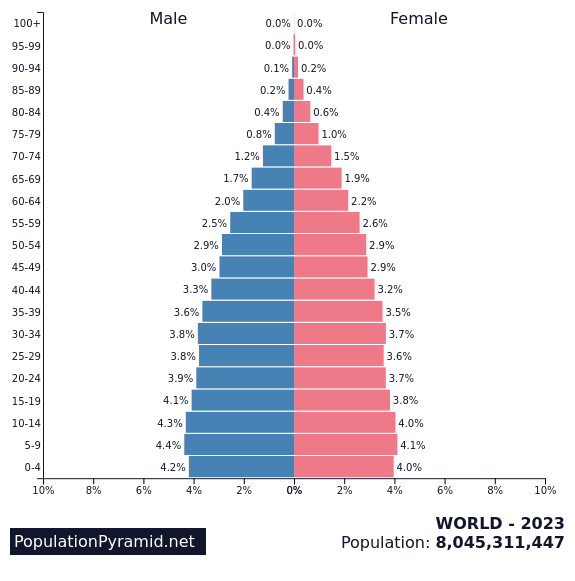
the Christmas Tree, the Box, and the Cup. They each represent different conditions within countries. For example, whether the country is developing, developed, or impoverished, has a high or low birth rate, short or long life expectancy, and other different growth rate statistics. We compared different countries and their different growth rates. We were able to also to make connections to events that were taking place in the world at the times where there were lots of babies being born compared to when there were not. For example, in the United States the largest percent of people were people younger than four years in the 1960s because it was after World War II so people were optimistic and were willing to start to families. Here are some examples of these pyramids.

No comments:
Post a Comment